Dashboard

Track applications and prospects from one panel — an overview, a lifecycle table, and a prospect funnel.

Last updated Aug 10, 2026

Your bird’s-eye view

The dashboard is where you go to answer one question: what needs my attention right now?

Open it from the sidebar and it fills the right panel as its own tab. Everything your team is working on lives here — deadlines, statuses, funders, assignments, amounts. One glance tells you what’s due this week, what’s stuck in review, and what’s quietly fallen behind.

Three sections, not one long list

Applications and prospects are different jobs. An application moves through a lifecycle you manage; a prospect is a decision you haven’t made yet. Mixing them into one table means every filter you set is half wrong.

So the dashboard splits into three sections, switched by the tab row at the top:

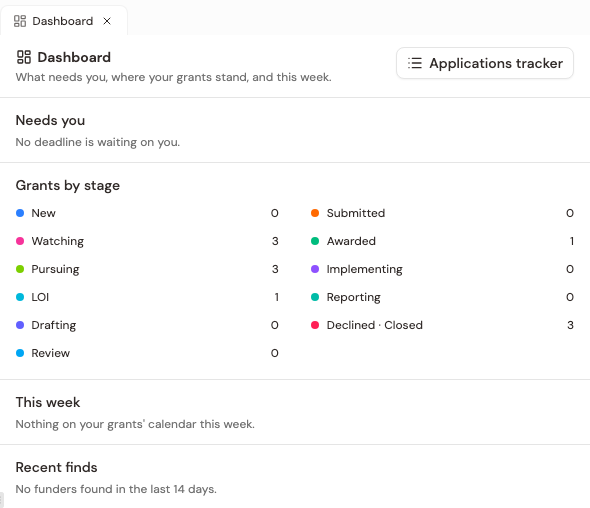
  • Overview — the summary across both, plus what’s due soonest.
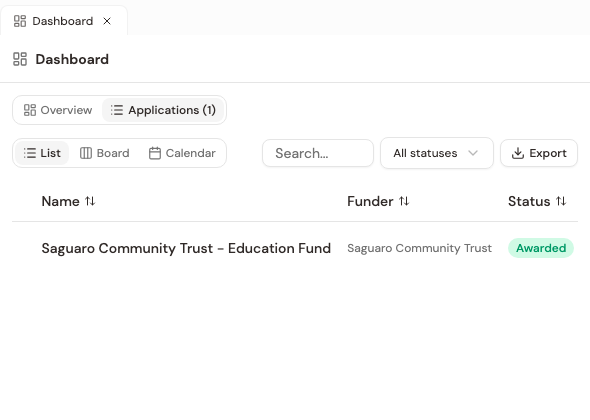
  • Applications (N) — the full lifecycle table for grants you’re pursuing.
  • Prospects (N) — the triage surface for funders you’re still deciding on.

Each section keeps its own filters and remembers which view you were last using, so switching between them doesn’t drag one section’s settings into the other.

The dashboard keeps itself updated

If you’ve used other project management tools, you’re used to the drill: create a project, manually set the status, remember to update it when things change, hope your team does the same. The dashboard ends up reflecting what people remember to log, not what’s actually happening.

Grantable works differently. As you work in your workspace — creating folders for applications, uploading RFPs, drafting proposal sections, submitting documents — Grantable tracks what’s happening and keeps the dashboard current. When you start working on an application, it moves to “In Progress.” When a draft goes through review, the status updates. When you tell the AI you’ve submitted, it marks it submitted.

Here’s what’s going on behind the scenes: every folder and file in your workspace can carry metadata — status, due date, funder name, grant amount, stage. When a folder in your Applications or Prospecting workspace has a due date, it shows up in the dashboard automatically. As work progresses, the AI updates these fields based on what’s actually happening in the workspace.

You don’t need to know how the metadata works or where it lives. Just know that the dashboard is drawing from the real state of your workspace, not from a separate tracking system you have to maintain.

And you can always override it. Change any field directly in the dashboard — click a status, update a deadline, reassign a team member. The AI picks up manual changes too, so there’s no conflict between what you set and what the AI tracks. You can also tell the AI in chat: “Move the NEA application to Under Review” or “Push the Ford Foundation deadline to June 30” — it updates the dashboard immediately.

Overview — the two-minute read

The Overview is the section you open to. It gives you three things and nothing else:

Applications at a glance — four cards covering Active, Submitted, Awarded, and Declined. Each shows a count and the dollars behind it.

Prospects at a glance — three cards covering New, Accepted, and Dismissed, with the total you’d be asking for. Note the difference in what the money means: applications report what a grant is worth, prospects report what you’d be asking for. They’re different questions, so they use different numbers.

Upcoming deadlines — the next five due dates across both folders, soonest first. Overdue shows red, urgent shows amber. Anything finished — awarded, declined, archived, or a dismissed prospect — drops off, so a closed grant’s old submission date never crowds out something you can still act on.

Both summary headings are clickable. Hit View all to jump straight into that section.

Applications — the lifecycle table

Three views of the same grants. Pick whichever matches how you think.

List — the power-user default

Dashboard list view showing grant projects with inline-editable fields for status, deadline, funder, and stage

If you like spreadsheets, you’ll feel at home here. The list shows every application in an interactive table where you can sort, filter, and — most importantly — edit fields right in the row.

Click a status to change it. Click a deadline to push it. Reassign a team member without ever opening the project. Changes save automatically, so you can blow through a dozen quick updates in the time it would take to open and close each one individually.

Sort by deadline to see what’s coming up. Filter by team member to check someone’s workload. Filter by status to find everything stuck in draft.

Board — the visual pipeline

Dashboard board view showing grant projects organized in columns by status, with move-between-stage controls

Columns organized by status — Not Started, In Progress, Under Review, Submitted, and on through the lifecycle. If your team works on grants at different stages simultaneously, the board shows the shape of your pipeline: whether everything is bunched up in drafting, or you’ve got a healthy spread.

Use each card’s Move to… control to send a grant to the next stage. It’s especially useful in team settings where several people need the big picture without asking each other for updates.

Calendar — see your month

Dashboard calendar view showing grant deadlines spread across a monthly calendar

The calendar lays out every deadline on the date it’s actually due. You’ll immediately spot the weeks where three grants land at once — and the quiet stretches where you could get ahead on something.

This is the view that prevents the “oh no, that was due yesterday” moment. Anything without a due date collects in a No due date row underneath, so nothing goes missing just because nobody dated it.

Prospects — the funnel

Prospects get their own views, because triage isn’t lifecycle management. There’s no board here: a prospect you haven’t decided on doesn’t have a status pipeline to drag it through.

Funnel is where the section opens. It groups prospects by pipeline stage — New, Watching, Pursuing, Drafting, Submitted, Closed — so you can see how many funders are sitting undecided versus how many you’ve actually committed to. Advance one and the move is recorded like any other change. Dismissed prospects leave the funnel entirely rather than occupying a column.

List gives you the same prospects as a sortable table, with prospect-specific columns — fit, accept/dismiss status, and which search turned the funder up.

Calendar places prospect deadlines on the month, the same way it does for applications.

Runs is the history of your prospecting searches. Each run links back to the conversation it happened in, so when a funder shows up in your pipeline six weeks later you can still find out where it came from.

Creating projects

You can create projects from any view using the new project button — add the funder, deadline, and initial details.

Or skip the form entirely and tell the AI: “Create a project for the Ford Foundation LOI due May 15.” It’ll set up the project with the right metadata and you can tweak anything from the dashboard afterward.

You can also just start working — create a folder in your Applications workspace, start uploading documents, and the dashboard picks it up as soon as there’s enough context to track.

Pro tip

Start each week on the Overview. Two minutes on the deadline list and the summary cards tells you where the week is going. Then drop into Applications → List for quick status updates, and into Prospects → Funnel to clear anything still sitting in New.

If something looks off — a wrong status, a missing deadline — just tell the AI. “Update all my active applications with their current statuses” or “Set the deadline for the Kresge proposal to April 15.” The dashboard is a living view of your work, not a static spreadsheet you have to maintain.

Related

© 2026 Grantable. All rights reserved.